Web Analytics Dashboard
Project | Web Analytics Dashboard
The Challenge
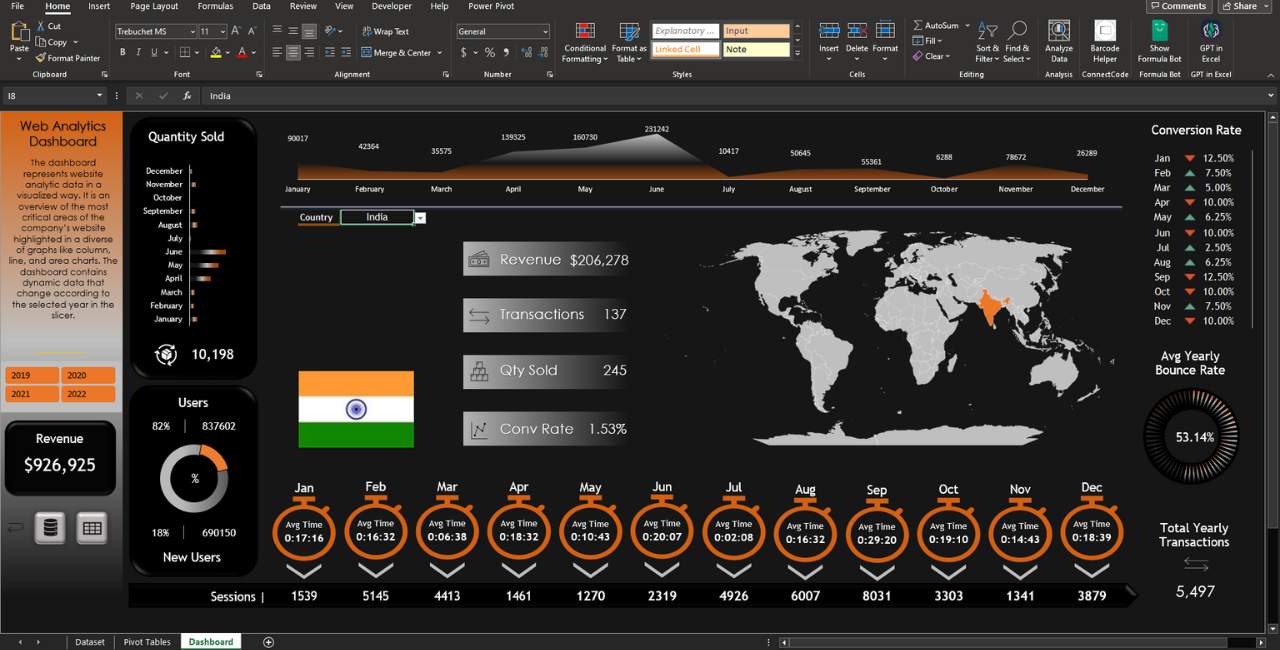
The goal is to transform complex data into meaningful insights about vital website metrics—think page views, unique visitors, bounce rate, and transactions. Through visually appealing graphs and tables in an Excel spreadsheet, our dashboard makes data a breeze to understand for all levels. We spotlight key data points that map the customer journey, using a harmonious color palette throughout.
Social Media Engagement Dashboard
Project | Social Media Engagement Dashboard
The Challenge
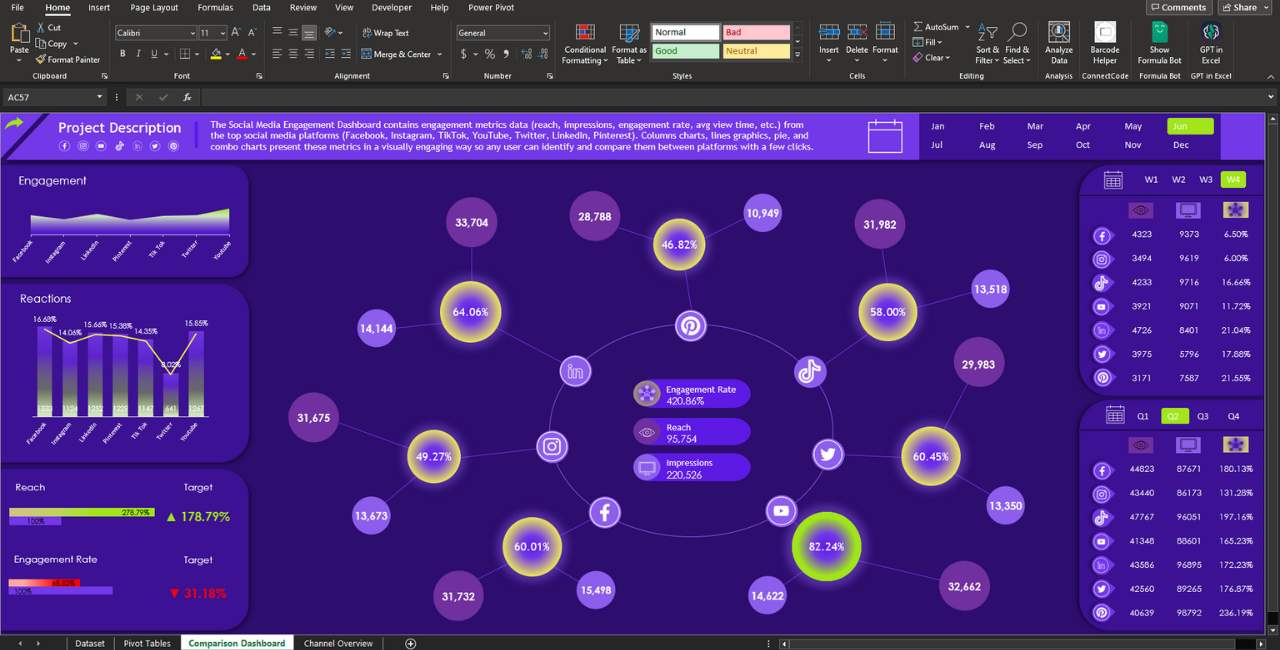
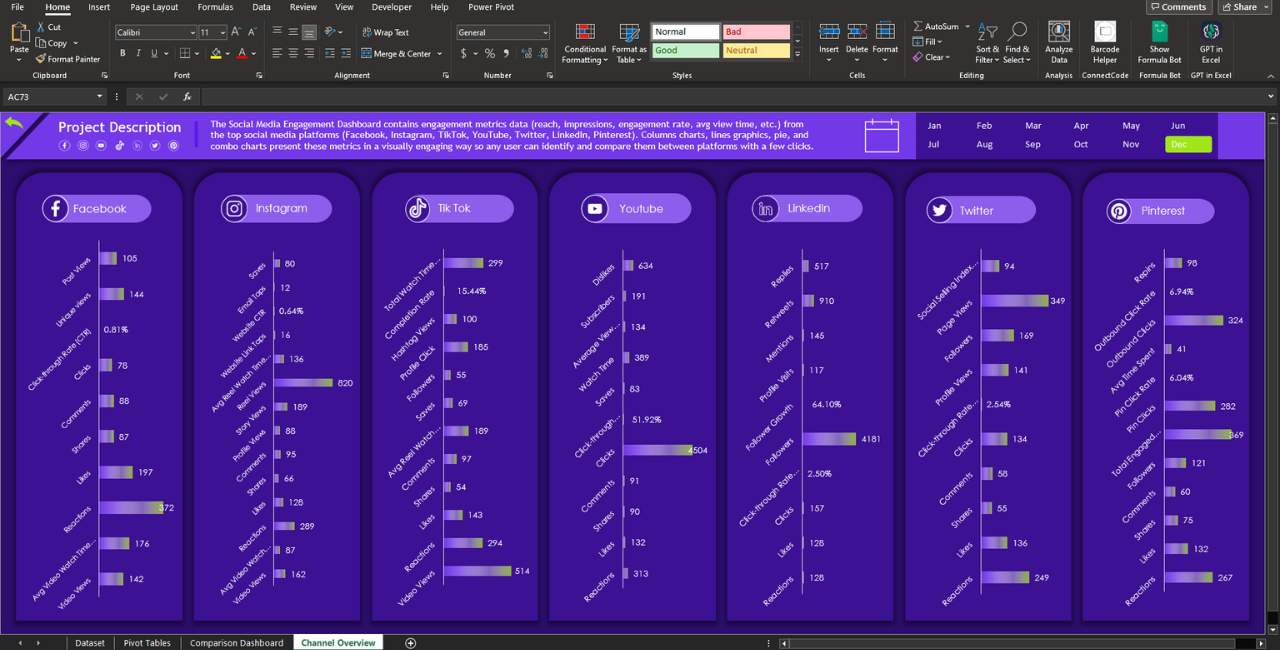
Navigating social media stats is a great challenge, especially when it comes to identifying trends and working on aligning them with your business’s KPIs. This project targets to dive deep into the yearly performance of the top seven social platforms. The goal is to visually display these insights and give a clear picture of the vital engagement metrics.
SEO Dashboard
Project | SEO Metric Performance Analysis
The Challenge
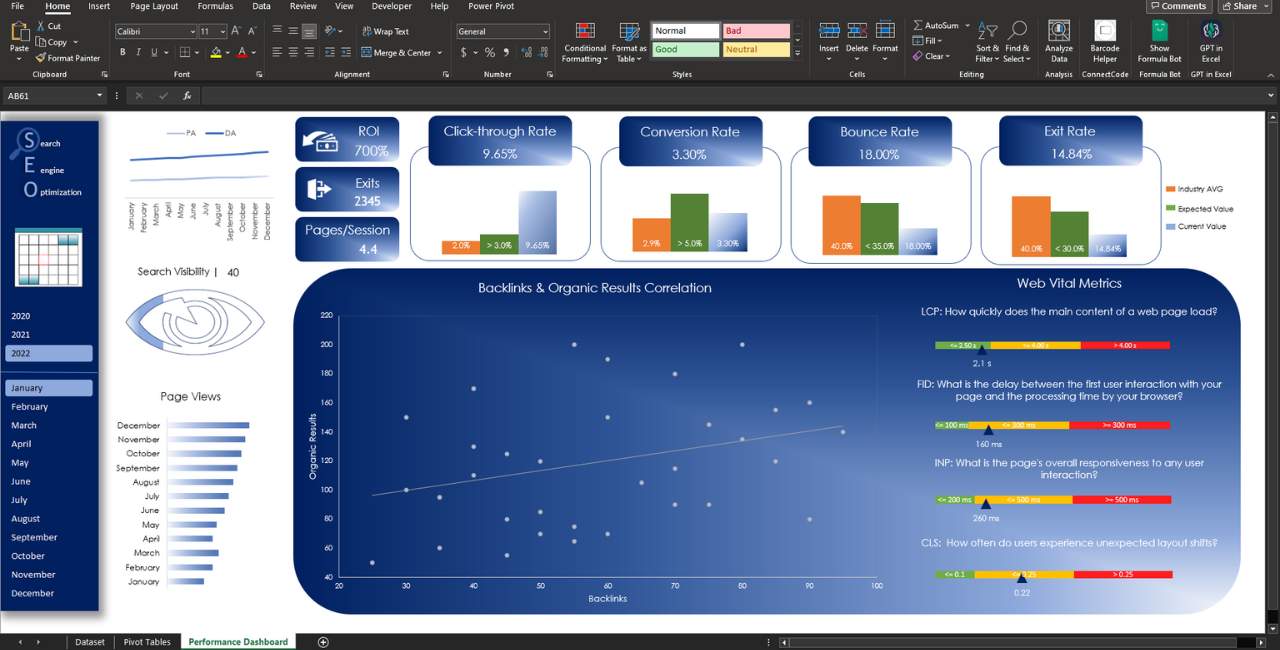
The SEO performance analysis project aims to provide a clear and complete view of website performance metrics. It allows businesses easily track and analyze their SEO efforts, uncovering opportunities for improvement. By visualizing these insights, we can spot trends over months and proceed to more precise and effective strategies
Google Ads Campaign Dashboard
Project | Google Ads Campaign Dashboard
The Challenge
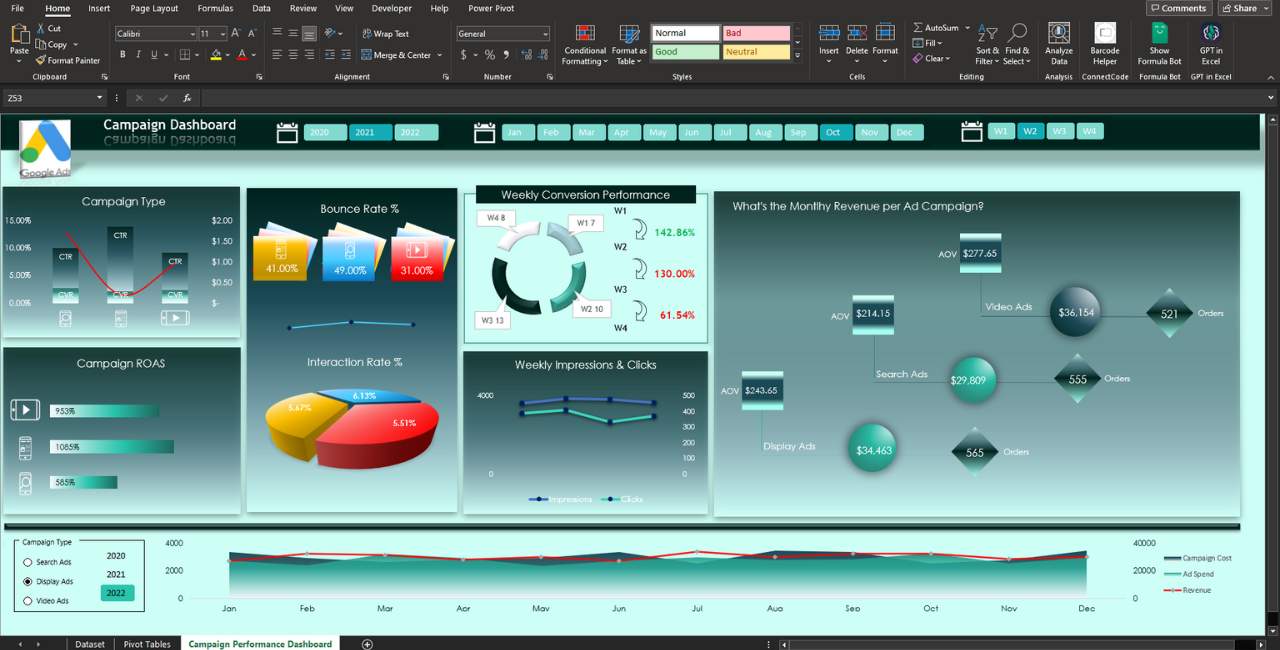
The Google Ads Campaign Dashboard thoroughly analyzes the underlying paid advertising data through visually beautiful and informative graphics. Marketing managers and professionals gain the ability to determine crucial insights for each campaign type on weekly, monthly, and yearly timeframes. The primary objective of this Excel dynamic dashboard is to facilitate quick, data-driven decision-making, highlight areas for enhancement, and evaluate the overall performance of each campaign type.
Keyword Analysis Template
Project | Keyword Analysis Template
The Challenge
The Keyword Analysis and Campaign Structure template is a tool designed to help the user streamline the process of identifying keywords and organizing campaigns more efficiently.
The user can automatically import keywords from a CSV file (downloaded from Keyword Planner) into the analysis area and then select and list the ones to use for the campaign.

Customer Avatar Template
Project | Customer Avatar Template
The Challenge
The Customer Avatar template enables detailed structuring of the ideal customer. It includes 4 personas for comparison to find the perfect fit for your business goals. The automation features allow you to print a PDF for your persona with just one click.

Google Ads Campaign Optimization Template
Project | Google Ads Campaign Optimization Template
The Challenge
The Google Ads Campaign Optimization tool is designed to help users analyze data performance more quickly and effectively. It allows for importing a CSV file at four levels: campaign, ad group, keyword, and asset. With just one click, users can access real-time recommendations.


Social Media Statistics Dashboard
Project | Social Media Usage Dashboard (2022 Stats)
The Challenge
How are individuals utilizing social media? The purpose is to examine social platform usage according to 2022 stats. Raw data is transformed into beautiful visuals, providing a panoramic view. With a predictive sheet, the social media dashboard forecasts platform popularity over a decade (2017-2027), uncovering global trends. Get familiar with the influence of social networks across nations, validating rankings by usage duration and daily engagement across age groups.